
Lactate Threshold:
Find your edge! Measure how efficiently your body fights fatigue and sustains intensity so you can push your performance limits further with a Lactate Threshold test at the CHAMP Center!
Lactate Threshold (LT): What It Is
A Lactate Threshold Test evaluates how your body responds to increasing exercise intensity and how it manages fatigue. Lactate is a natural byproduct of working muscles. At lower intensities, lactate production and clearance remain balanced, allowing exercise to feel comfortable and sustainable. As intensity rises, lactate can accumulate faster than it can be cleared, contributing to fatigue and the need to slow down.
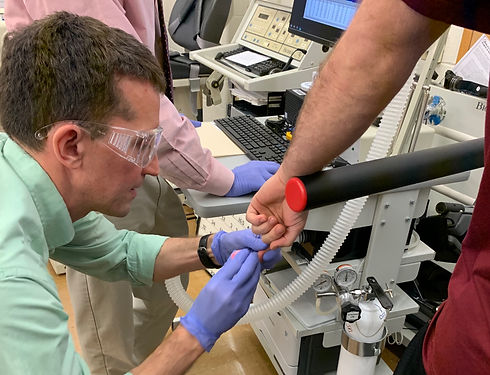
The lactate threshold marks the highest intensity the body can sustain before fatigue accelerates, serving as a key indicator of endurance capacity and training efficiency. The test uses a gradual, stepwise protocol in which participants wear a metabolic mask and heart rate monitor while small finger-prick blood samples are collected at intervals. Two thresholds are identified: Lactate Threshold 1 (LT1), marking the shift to moderate effort, and Lactate Threshold 2 (LT2), representing the highest sustainable intensity before fatigue rises rapidly. Testing typically lasts 35-50 minutes, not including warm-up and cool-down. Further preparation details can be found on the CHAMP Center Prepare Page.
At the CHAMP Center, testing is performed on a treadmill or stationary cycle ergometer, with additional options for a personal bike or rowing machine. All assessments use the TrueOne® Parvo Medics metabolic cart, a system trusted by NASA, U.S. Olympic Training Centers, and leading research institutions worldwide.

LT: Why It's Important
Lactate Threshold reflects how efficiently the body manages fatigue as exercise intensity increases. It marks the highest intensity that can be sustained before lactate accumulates faster than it can be cleared, signaling accelerated fatigue. Unlike VO₂ max, which measures maximal aerobic capacity, Lactate Threshold indicates how effectively that capacity can be applied in day-to-day training or performance.
Understanding Lactate Threshold allows participants to:
• Sustain higher intensities for longer durations before fatigue sets in
• Establish precise heart rate, pace, or power targets for structured training
• Optimize efficiency through targeted aerobic and threshold-based programming
• Balance training stress and recovery to reduce overtraining risk
• Track meaningful improvements in endurance and workload tolerance
Because many fitness and performance goals depend on sustained effort rather than maximal intensity, Lactate Threshold is a highly actionable metric for guiding training.
At the CHAMP Center, we can customize the LT testing protocol to match each individual’s fitness level, ensuring accurate results that align with personal goals so that training and health strategies are meaningful.

LT: Who Should Do It
Lactate Threshold testing identifies the exercise intensity at which lactate accumulates faster than it can be cleared, limiting sustained performance. This test benefits anyone seeking to better manage fatigue and optimize training intensity, including:
-
Endurance Athletes: Refine pacing and training zones for races and long-duration events.
-
Field and Court Athletes: Improve repeated high-intensity efforts and recovery.
-
Recreational Exercisers: Train more efficiently and safely.
-
Interval and high-intensity trainers: Optimize effort and recovery during structured workouts.
-
Zone-Based Training: Define accurate training zones for tempo, threshold, and aerobic development sessions.

LT: Interpreting Results
Your Lactate Threshold results reveal how efficiently your body manages rising effort before fatigue limits performance. Unlike peak tests, this shows how long you can sustain intensity without excessive lactate accumulation.
Lactate Threshold results vary based on training status, fitness level, sport demands, and individual physiology. After testing, CHAMP Center staff interpret results by identifying where LT1 and LT2 occur during exercise and plotting these points on a graph against heart rate and pace or power. This individualized approach allows results to reflect how the body manages fatigue and sustains effort rather than how it compares to a general population.
Key Metrics Include:
-
Lactate Thresholds (LT1/LT2)
-
Heart Rate at LT1 and LT2
-
Pace or Power at LT1 and LT2
-
Blood Lactate Response Curve
-
Ratings of Perceived Exertion (RPE)
View the other tabs to read more on each metric.
Lactate Thresholds:
Lactate Threshold 1 (LT1):
LT1 represents the first sustained rise in blood lactate above resting levels and marks the transition from very easy aerobic exercise to moderate intensity. Physiologically, this is the point where breathing begins to increase slightly, and lactate production starts to rise but remains well controlled.
Higher LT1 values occurring at faster speeds, higher power, or lower heart rates indicate stronger aerobic efficiency and the ability to sustain longer durations of training with minimal fatigue. LT1 is commonly used to define Zone 2 and other low-intensity aerobic training zones.
Lactate Threshold 2 (LT2):
LT2 reflects the intensity at which lactate accumulates rapidly and fatigue increases sharply. At this point, breathing becomes noticeably labored, and the body relies more heavily on carbohydrate metabolism to sustain effort.
Higher LT2 values indicate improved tolerance for sustained hard efforts and greater endurance performance potential. LT2 is commonly used to guide tempo training, threshold workouts, and race-pace intensity for endurance athletes.
Heart Rate at LT1 and LT2:
Shows how your cardiovascular system responds as exercise intensity increases throughout the test. Your results display heart rate in relation to LT1 and LT2, allowing training to be set with greater precision than relying on generic formulas, which may not account for individual fitness, metabolic response, or training history.Over time, improvements may be reflected by sustaining higher workloads at the same heart rate or by a lower heart rate at the same workload, both indicating enhanced aerobic efficiency and endurance capacity.
Pace or Power at LT1 & LT2:
This metric represents the speed or power output achieved at LT1 and LT2 during the assessment. Your results present pace or power in relation to each threshold, providing clear workload targets for structuring endurance training, tempo efforts, and interval sessions with accuracy and consistency. Increases in pace or power at LT1 or LT2 indicate improvements in sustainable performance capacity and fatigue resistance.
Ratings of Perceived Exertion (RPE):
RPE links subjective effort with physiological responses. When a given workload feels easier over time despite similar physiological markers, it reflects improved efficiency and conditioning. At the CHAMP Center we use the Borg scale which rates perceived exertion from 6 (no exertion) to 20 (maximum exertion). As your aerobic capacity improves the same workload should feel easier. You can view an example Borg scale here.
How to Use Your Results:
-
Establish precise, individualized training zones based on LT1 and LT2
-
Monitor changes every three to six months to assess fatigue resistance and sustainable intensity
-
Use threshold shifts to evaluate whether training is appropriately balanced between aerobic volume and intensity
-
Improve pacing strategies for endurance events and interval-based workouts
-
Pair LT results with VO₂ max and Substrate Utilization testing for a comprehensive aerobic performance and energy profile. Check out our Aerobic Performance Package which combines all three!
Blood Lactate Response Curve:
The lactate curve illustrates how blood lactate levels change as exercise intensity increases. By analyzing this curve, we can identify both LT1 (the upper boundary of sustainable low-intensity work) and LT2 (the highest intensity you can sustain before lactate accumulates rapidly).
-
Gradual rise in lactate (up to LT1):
Indicates balanced lactate production and clearance. A slower rise suggests strong aerobic efficiency, metabolic flexibility, and the ability to sustain moderate-intensity efforts longer.
-
Steeper rise in lactate (approaching LT2):
Marks the transition from aerobic to high-intensity metabolism. LT2 reflects your tolerance for sustained hard efforts and overall endurance potential.
-
Curve shape between LT1 and LT2:
A wider gap and moderate slope indicate efficient fatigue management and a strong aerobic base, while a narrow gap or sharp slope may highlight a need for targeted threshold training.
-
Shifts over time:
A rightward shift of LT1 or LT2 indicates you can sustain higher workloads before lactate accumulation, reflecting improved efficiency and endurance. A leftward shift may suggest reduced aerobic efficiency, fatigue, or recovery deficits.