
DEXA
You are more than a number on the scale. Discover what your body is truly made of with a DEXA scan, the gold standard for body composition assessment, at the CHAMP Center.
DEXA: What It Is
Dual-Energy X-Ray Absorptiometry (DEXA) is a highly accurate and practical method for assessing and analyzing whole-body composition. By passing low-dose X-ray beams through the body, DEXA differentiates between bone, lean tissue, and fat, providing precise measurements of fat mass, lean mass, bone mineral density, and regional distribution.
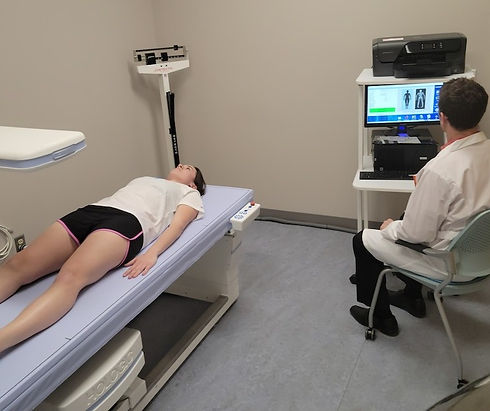
DEXA scans are noninvasive, painless, and typically take five to ten minutes. Participants lie on their back while a scanner passes over the body, requiring minimal movement. The assessment provides detailed insights, including body fat percentage (subcutaneous vs. visceral), lean body mass, total body mass, bone density, and regional analysis of trunk and limbs. Further preparation details can be found on the CHAMP Center Prepare Page.
At the CHAMP Center, DEXA testing is performed using the Horizon® DXA system from Hologic, a platform trusted by leading research institutions (including the Applied Science and Performance Institute), sports performance programs, and healthcare facilities worldwide.

DEXA: Why It's Important
Scale weight alone cannot distinguish between fat, lean tissue, and bone, nor reveal how mass is distributed throughout the body. DEXA provides a comprehensive, region-specific view of body composition, highlighting changes often missed by the scale. This information is essential for informed training, nutrition, and long-term health decisions.
Understanding DEXA results allows participants to:
• Determine whether priorities should focus on lean mass gain, fat loss, or both
• Identify visceral fat levels linked to metabolic and cardiovascular health
• Monitor bone density to support skeletal strength and resilience
• Detect asymmetries or regional differences that may influence performance or injury risk
• Track meaningful changes even when scale weight remains unchanged
DEXA provides a structural snapshot of the body that supports informed decisions about training, nutrition, and long-term health.

DEXA: Who Should Do It
DEXA measures lean mass, fat mass, visceral fat, and bone mineral density to provide a detailed view of body composition and skeletal health. This test benefits anyone seeking precise insights into body composition and bone health, including those who are:
-
Body Recomposition Focused: Track whether changes come from fat or muscle to guide training and nutrition.
-
Monitoring Visceral Fat: Assess deep belly fat to reduce metabolic and cardiovascular risk.
-
Prioritizing Bone Density: Monitor bone tissue before bone health risk increases.
-
Athletes or Active Individuals: Evaluate muscle development, symmetry, and recovery.
-
Focused on Longevity: Understand markers that matter with age: muscle mass, fat distribution, and bone strength.
-
Women across Life Stages: Track and understand composition changes during perimenopause and post-menopause.

DEXA: Interpreting Results
Your DEXA results offer a precise look at your body’s structural makeup, including how lean mass, fat mass, and bone are distributed throughout the body. This information goes beyond scale weight to provide meaningful insight into your health and performance goals.
Rather than focusing on appearance or a single number, DEXA highlights where tissue is located and how it supports function. Patterns of lean mass, fat distribution, and bone density help explain how your body responds to training, aging, nutrition, and recovery. CHAMP Center staff interpret these results using clinically and performance-relevant metrics to place them in context with your goals, training history, and overall health profile.
Key Metrics Include:
-
Lean Mass
-
Fat Mass & Percentage
-
Visceral Adipose Tissue (VAT)
-
Fat Mass Index (FMI)
-
Bone Metrics (Area, BMC, BMD)
-
Regional Analysis
-
Android/Gynoid Fat Distribution
-
Percentile Comparisons (AM%, YN%, PR%)
View the other tabs to read more on each metric.
Fat Mass (g) & Percentage:
This metric reflects total body fat and how it is distributed throughout the body, reported as both absolute mass (g) and relative percentage of total body weight. Tracking fat mass and body fat percentage over time allows changes in adiposity to be evaluated independently of body weight, which can fluctuate due to hydration, muscle gain, or training load.
Higher values may be associated with increased metabolic or cardiovascular risk, particularly when accompanied by elevated visceral fat. Lower values indicate reduced adiposity but should always be interpreted alongside lean mass to ensure adequate muscle mass and overall metabolic health are maintained.
How it’s used:
This metric is useful for tracking fat loss or gain over time, evaluating the effectiveness of nutrition and training strategies, and distinguishing meaningful body composition changes from scale weight alone.
Reference ranges (general examples):
-
Men: ~18–24%
-
Women: ~25–31%
*Average ranges vary based on age, activity level, ethnicity, and health status.
Visceral Adipose Tissue (VAT):
Visceral adipose tissue (VAT) is the deep abdominal fat surrounding internal organs and is strongly linked to metabolic and cardiovascular risk because it is more metabolically active than subcutaneous fat. It secretes hormones and inflammatory compounds that can impact insulin sensitivity, lipid metabolism, and overall cardiovascular health. Lower VAT values are generally favorable, while higher values indicate increased cardiometabolic risk.
DEXA provides several measures of VAT to help quantify this risk:
-
VAT Mass (g): The total weight of visceral fat in grams.
-
VAT Volume (cm³): The total space visceral fat occupies, providing context for overall abdominal adiposity.
-
VAT Area (cm²): The cross-sectional area at a standard anatomical location (usually at the abdomen); this measure is often referenced clinically as a key indicator of metabolic risk.
-
Target VAT Area: <100 cm² (general guideline)
-
How it’s used:
VAT is a key metric for identifying hidden metabolic risk and guiding lifestyle, nutrition, and training strategies aimed at improving long-term health and disease prevention.
Regional Analysis:
Regional analysis breaks down fat mass, lean mass, and bone content by body segment, including arms, legs, trunk, and pelvis.
Asymmetries between sides may reflect strength imbalances, movement inefficiencies, injury history, or sport-specific adaptations.
How it’s used:
This data supports individualized training, rehabilitation planning, and monitoring symmetry changes over time.
Bone Metrics:
DEXA provides several bone-related metrics that offer a detailed view of skeletal health, strength, and resilience. These measures help distinguish bone size, total mineral content, and bone density, allowing for accurate interpretation across different body types, training backgrounds, and life stages.
Bone Area (cm²):
Bone area represents the surface area of bone scanned by DEXA. It provides context for interpreting both BMC and BMD, since larger bones naturally contain more mineral and may have higher total values without necessarily being denser.
-
Helps normalize bone mass and density across individuals
-
Important for comparing BMD relative to bone size
Bone Mineral Content (BMC):
BMC represents the total amount of mineral content, primarily calcium and phosphorus, contained within the bones, measured in grams. Unlike BMD, which reflects density, BMC reflects total bone mass rather than how tightly that mineral is packed.
-
Reflects the quantity of bone mineral.
-
Influenced by body size, skeletal frame, age, and long-term training history
-
Larger bones naturally have higher BMC
-
Useful for contextualizing bone health alongside lean mass and body size
Bone Mineral Density (BMD):
BMD represents how densely packed the bone mineral is within a given area, measured in g/cm².
-
Reflects bone strength relative to size.
-
The primary metric used for assessing fracture risk.
-
Normalized for bone area, making it more comparable across individuals.
-
Key metric used in T-scores and Z-scores.
T-score:
Compares your BMD to a healthy 30-year-old adult reference population of the same sex.
-
A higher T-score reflects greater bone density relative to peak adult levels.
-
Values at or above –1.0 indicate generally strong bone density
-
Values below –1.0 suggest reduced bone density relative to peak norms and may warrant further investigation by a qualified physician.
Z-score:
Compares your BMD to an age- and sex-matched population.
-
A Z-score of 0 reflects average bone density for your peers.
-
Values above 0 indicate higher-than-average bone density
-
Values below 0 indicate lower-than-expected bone density for your age
How It Fits Together:
At the CHAMP Center, bone results are interpreted by integrating:
-
Bone Area (cm²) to contextualize skeletal size
-
BMC to assess total bone mass
-
BMD to assess bone strength relative to size
-
T-scores to compare against peak adult norms
-
Z-scores and percentiles to compare against age- and sex-matched expectations
These metrics provide a comprehensive view of skeletal health, guiding training, nutrition, and lifestyle strategies to maintain bone strength, resilience, and long-term health.
How to Use Your Results:
-
Track changes in lean mass, fat mass, and body fat percentage over time to evaluate training, nutrition, and recovery effectiveness independent of body weight
-
Use visceral fat and android/gynoid ratios to assess metabolic and cardiovascular risk and to guide interventions aimed at healthy fat distribution
-
Monitor regional analysis to identify asymmetries or imbalances that may impact performance, injury risk, or rehabilitation strategies
-
Use bone metrics to guide training, nutrition, and lifestyle strategies for maintaining or improving skeletal strength and long-term bone health
-
Reference AM%, YN%, and PR% percentiles to contextualize body composition and bone health relative to peers and peak physiological norms
-
Pair DEXA results with other assessments, such as VO₂ max or RMR, to create a comprehensive picture of body composition, metabolic efficiency, and performance potential. Visit our Packages Page to explore bundles that include DEXA!
Lean Mass (g) + BMC & Percentage:
Lean mass represents all non-fat tissue, all non-fat tissue in the body, including skeletal muscle, organs, connective tissue, and bone mineral content (BMC). It is a key determinant of strength, metabolic rate, functional capacity, and resilience to injury and aging.
Higher lean mass supports improved performance, metabolic health, and recovery capacity. Lower values may reflect muscle loss, inadequate training stimulus, insufficient nutrition, or recovery deficits, particularly during periods of high stress, illness, or aging.
How it’s used:
Lean mass is monitored to assess training adaptations, evaluate recovery and fueling adequacy, and track age-related or hormonally driven changes in muscle mass over time.
Fat Mass Index (FMI):
FMI adjusts fat mass relative to height, offering a clearer assessment of fat-related health risk than BMI alone. Unlike BMI, FMI separates fat mass from lean tissue, making it especially useful for individuals with higher muscle mass or similar body weights but different body compositions.
Higher FMI values are associated with increased metabolic and cardiovascular risk, while lower values generally reflect healthier fat mass relative to body size.
Why FMI matters:
Two individuals can share the same body weight and BMI yet have very different fat mass and health profiles. FMI helps clarify these differences and provides a more meaningful long-term tracking metric.
Recommended FMI ranges:
-
Men: ~3–6 kg/m²
-
Women: ~5–9 kg/m²
How it’s used:
FMI is particularly useful for long-term monitoring of fat mass changes and for contextualizing body composition in athletic or strength-trained populations where BMI may be misleading.
Percentile Comparisons (AM%, YN%, PR%):
DEXA provides several percentile-based comparisons to help contextualize your results relative to different reference populations. These percentiles show where your values fall compared to others, and interpretation depends on which metric is being evaluated (fat, muscle, or bone) as well as your individual health or performance goals.
Age-Matched (AM%) Percentile:
AM% compares your results to healthy adults of the same age and sex, providing context for expected age-related changes in body composition such as gradual muscle loss, shifts in fat distribution, or changes in bone density. This comparison helps distinguish normal aging-related changes from those more strongly influenced by training habits, nutrition, hormonal status, or lifestyle factors. AM% is particularly useful for monitoring long-term trends and supporting health, function, and performance as you age.
Young-Normal (YN%) Percentile:
YN% compares your results to a young, healthy reference population, typically representing peak physiological status. This metric reflects how closely your current body composition aligns with peak adult norms and provides insight into long-term resilience and physiological reserve. Maintaining higher YN% values for lean mass and bone density is associated with improved mobility, independence, and injury resistance later in life.
Percentile Rank (PR%):
PR% indicates where your result falls relative to a reference population and is most commonly reported alongside bone-related metrics, often in relation to T-scores. This percentile adds clarity to bone health assessment by showing relative standing within a population and supports early identification of bone loss when interpreted alongside absolute values and changes over time. PR% is most useful when monitored longitudinally rather than viewed as a standalone indicator.
Putting it Together:
DEXA percentiles place your body composition results into context by comparing your data to reference populations. Across all percentile metrics:
-
Higher percentiles (>50%) indicate values above the reference average
-
Lower percentiles (<50%) indicate values below the reference average
Whether a higher or lower percentile is desirable depends on the specific metric being evaluated:
-
Lean mass and bone metrics are favorable in higher percentiles
-
Fat-related metrics (total fat, visceral fat, regional fat) are favorable in lower percentiles
Android/Gynoid Fat Distribution:
This metric compares fat distribution between the android region (abdominal/trunk area) and the gynoid region (hips and thighs).
Higher android fat accumulation is more strongly associated with metabolic and cardiovascular risk because abdominal fat is more metabolically active. Fat stored in this region in excess has greater inflammatory and hormonal activity and is more closely linked to insulin resistance, dyslipidemia, and cardiovascular disease risk. Some abdominal fat is normal and necessary; concern arises when accumulation is disproportionately high relative to the hips and thighs.
Greater gynoid fat distribution is generally considered metabolically protective. Fat stored in the hips and thighs is less hormonally active and is associated with improved glucose regulation and lower cardiometabolic risk.
How it’s used:
Android/gynoid distribution provides additional insight into cardiometabolic risk beyond total fat mass and helps contextualize health risk independent of body weight. Tracking changes in android and gynoid fat distribution over time helps evaluate how training, nutrition, and lifestyle interventions influence not just how much fat is present, but where fat is stored. This distribution pattern provides important insight into metabolic health, long-term disease risk, and performance resilience.